Multi - Dimensional Report for Revive Statistics
The Multi-Dimensional Report plugin shows Revive Adserver statistics on one page as charts and data tables, grouped by the dimension you choose. It is for ad-ops teams and network account managers who need quick performance answers.
What it does
- Requests, impressions, clicks, CTR and conversions appear together, so a performance question is answered without switching screens.
- Grouping by campaign, banner, website, zone or date shows what performs, with filters for date, chart type and entity.
- Export to Excel, CSV and PDF supports client reporting, and fields can be shown or hidden with configurable pagination.
It adds a separate reporting interface; the default Revive Adserver statistics module stays available and unchanged.
Full feature details
Multi-Dimensional reporting add on used to see revive statistics in Graphical representation and also in Data table. All statistics information available in single page.
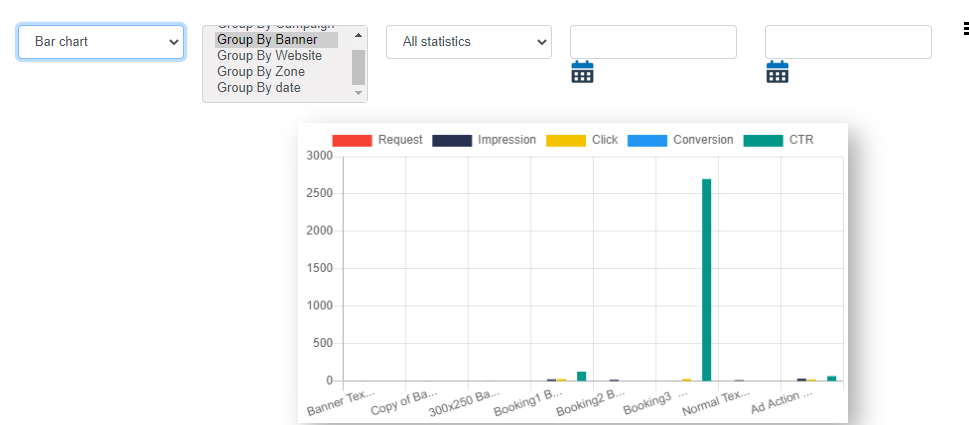
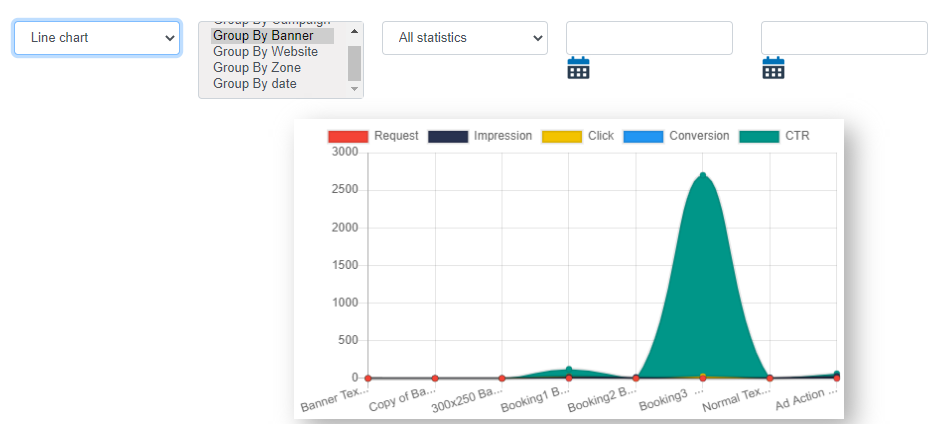
Graphical Representation support for following chart type and it contains the entity with Number of traffic information such as Requests, Impressions, Clicks, CTR and Conversions
Bar Chart
Line Chart
Pie Chart
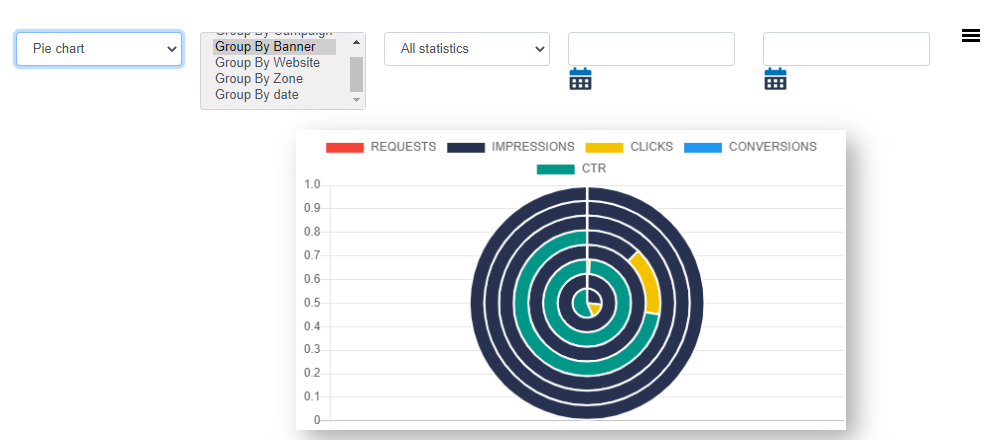
Filter By Date Picker, Type of Chart and Entity(Group By Campaign, Group By Banner, Group By Website, Group By Zone and Group By Date)
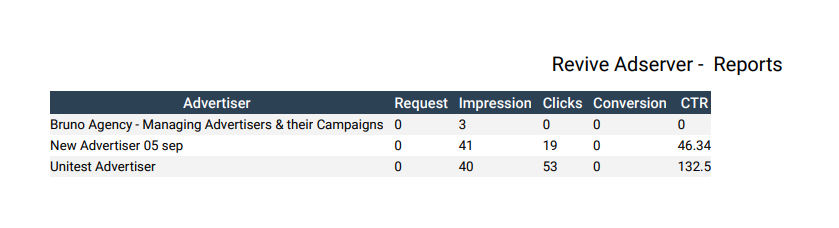
Data table contains the Entity name with Number of Requests, Impressions, Clicks, CTR and Conversions.
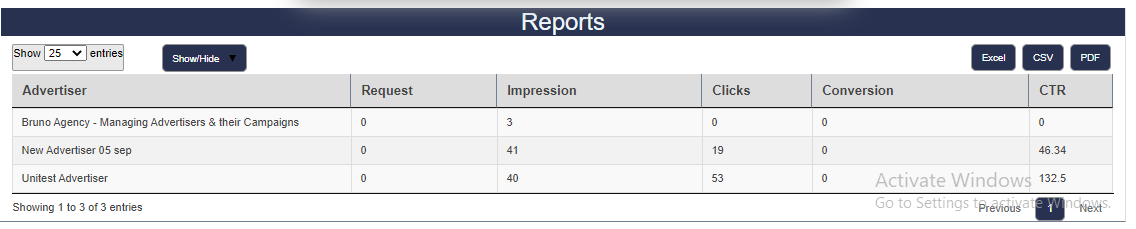
Show and Hide the field name customisable
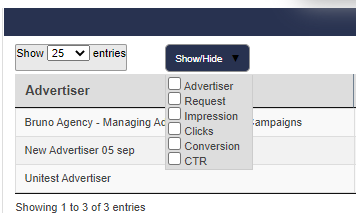
Pagination is customisable for reporting data
Export the Reports in following format
Excel
CSV
PDF
Frequently Asked Questions
Included with every plugin
- Installation and setup help. We help you install the plugin on your Revive Adserver and confirm that it is working.
- 3 weeks of free support from the day of delivery, covering installation, configuration and any bug in the plugin.
- Your Revive Adserver version. Choose your version in the Product Versions drop-down on this page.
- Licenses to fit your setup. Choose Single Domain, Multi Domain or Source Code in the License drop-down.
Need changes made for your setup? Custom work and consulting are available. Contact us with your requirements.
Common questions
Which Revive Adserver versions does this plugin support?
The supported versions are listed in the Product Versions drop-down on this page. If you run a version that is not listed, contact us before ordering.
What does the free support cover?
For 3 weeks from delivery we help with installation, configuration and any bug in the plugin. Custom development and problems caused by other plugins or your hosting are not part of the free support, but we can quote them separately.
Can you adapt the plugin to my setup?
Yes. Custom work is available. Tell us what you need and we will quote it.